Strategy charts
Contents
Strategy charting is a powerful tool for a strategy's graphical analysis. Strategy charting allows you to:
- Create charts of profit/loss and greeks on expiration date or base asset price;
- Create charts simultaneously for different scenarios (volatility change, time change, change in the price of the underlying asset); and
- Compare charts of different strategies.
Examples of charts are presented below.
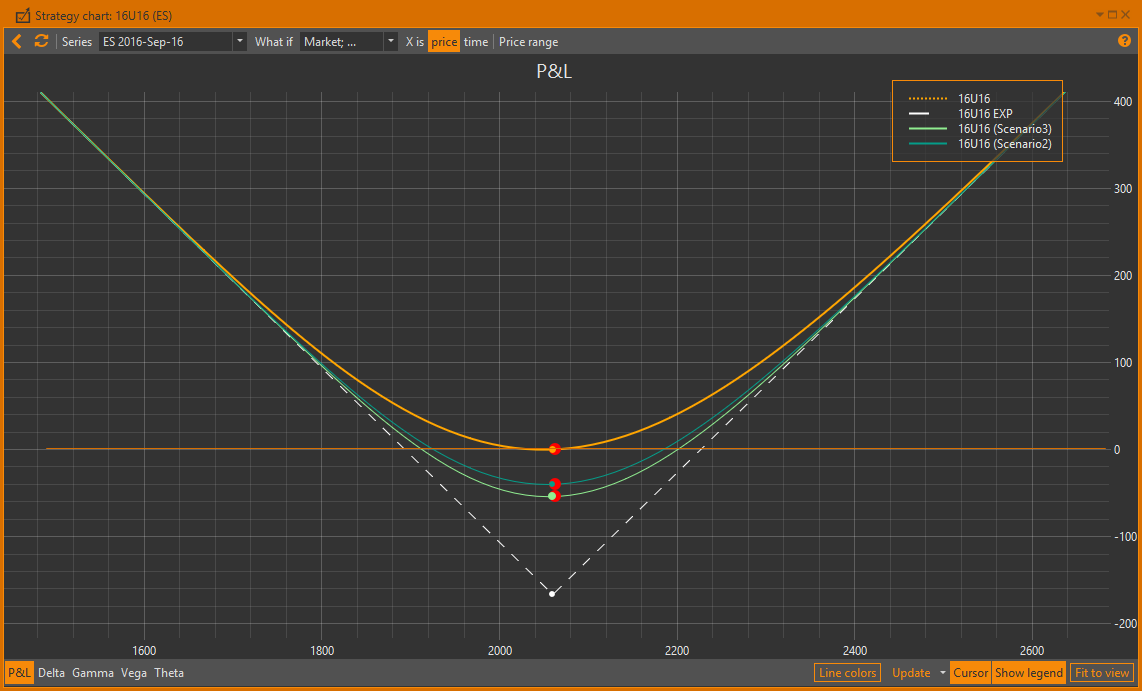

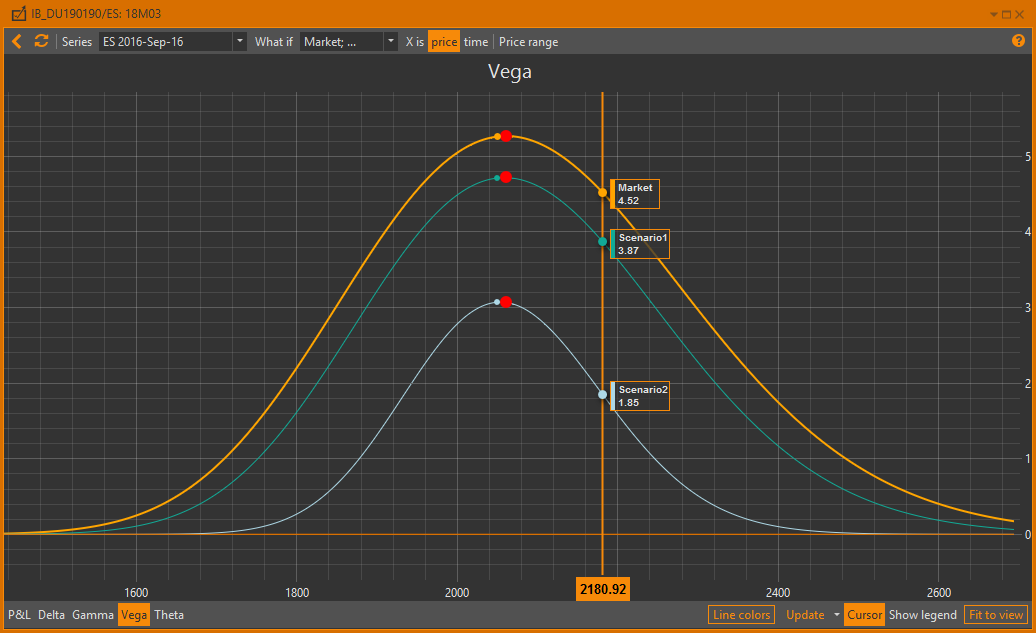

To open a Strategy charts, first select Account → Asset portfolio → Strategy. Then click the Chart button in the Positions form.

You may also choose more than one strategy simultaneously by selecting strategies while holding down the Ctrl or Shift keys on the keyboard.

After that, a Strategy charts window will open. Initially, it shows charts of profilt/loss, Delta, Gamma and Vega.
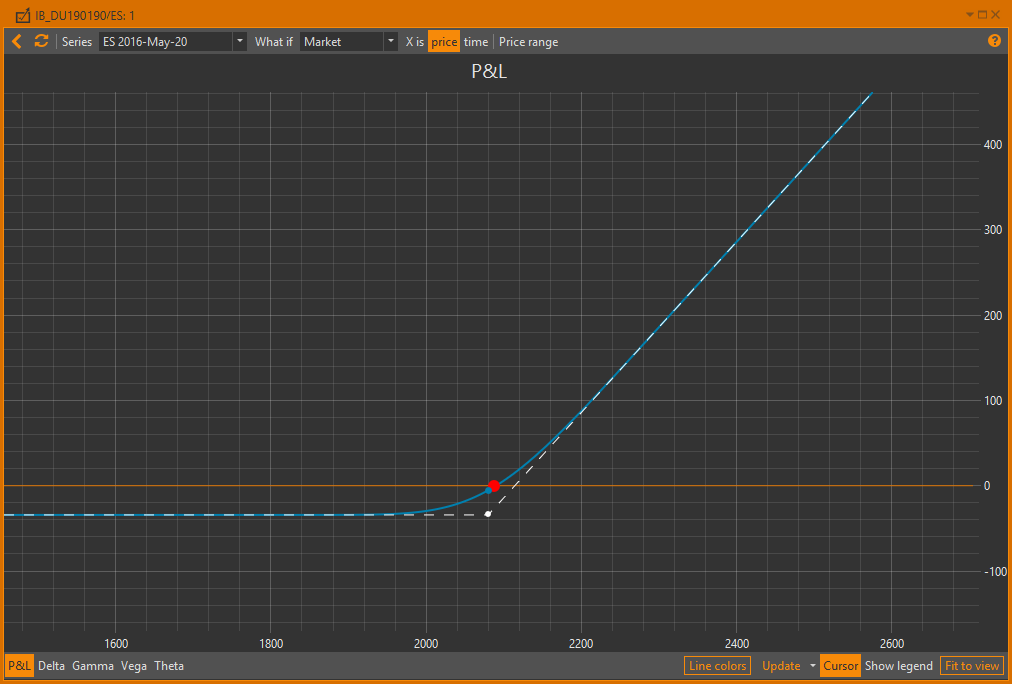
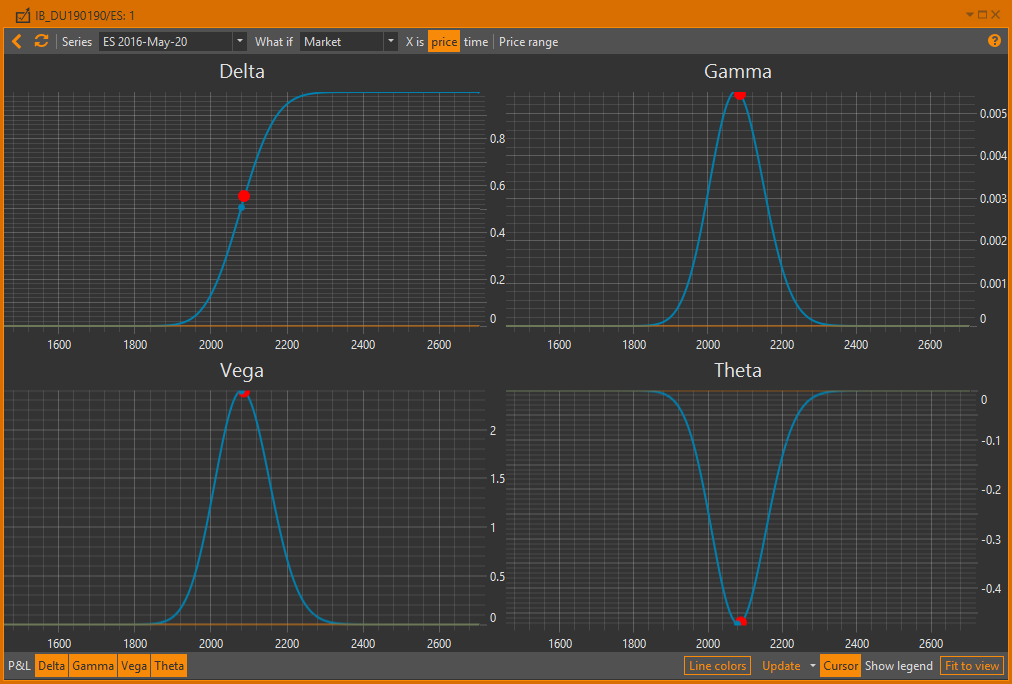
You may select charts to display using the PnL, Delta, GammaL, VegaL and Theta buttons on the bottom toolbar. OptionWorkshop remembers the last used chart settings (opened charts) and applies them to newly opened charts.
If you build charts for more than one strategy simultaneously you can select the strategies for which the profit / loss chart and the greeks charts display.
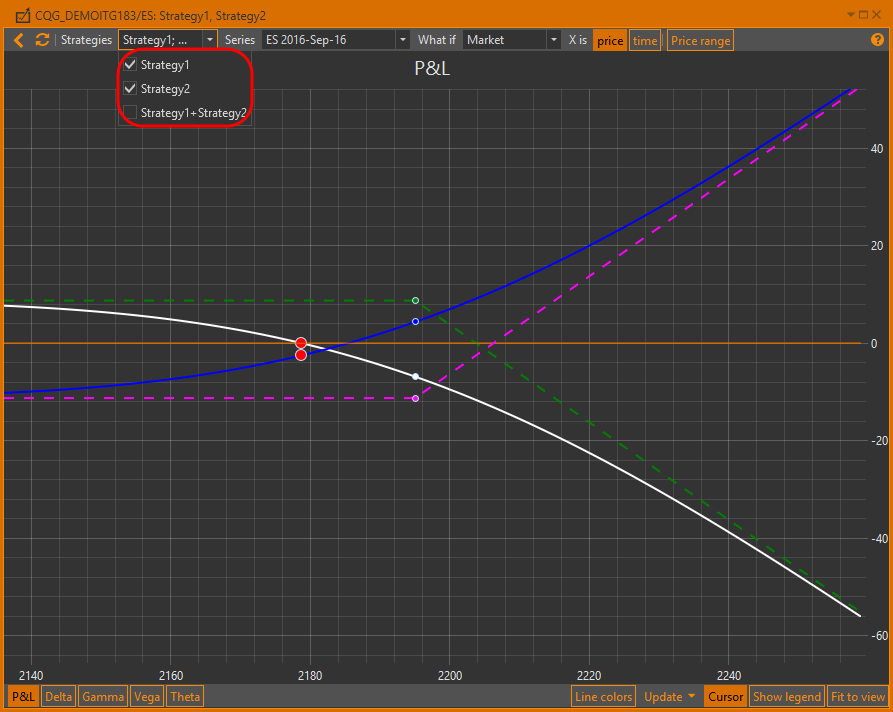
When you build a chart for a strategy containing options with different dates of expiration, the prices of the further futures are calculated as the price of the nearest futures, adjusted for the interest rate, which is set in the settings.
The Interest rate parameter is a risk-free interest rate. The value of this parameter affects the pricing models' computations. You can change the Interest rate in the Settings → Pricer tab section.
Let’s review the profit/loss chart:
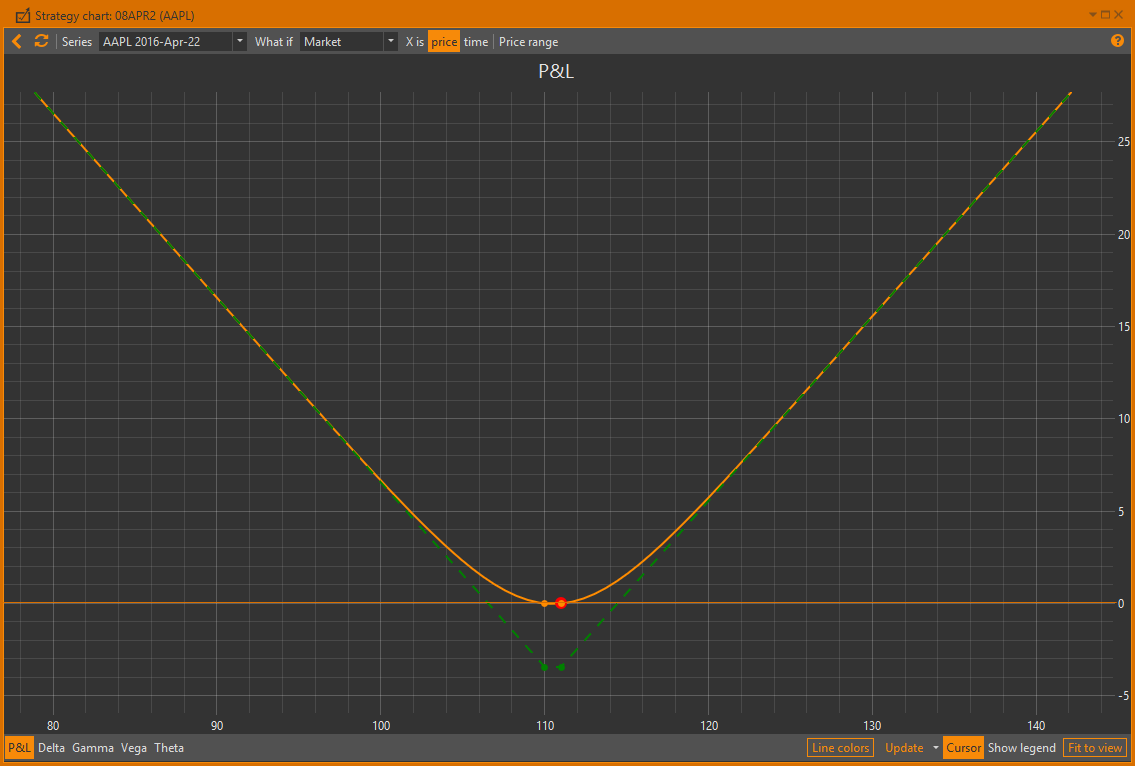
The X-axis shows the price of the underlying asset in a specified range.
For details on how to specify the prices range see the X-axis settingssection.
The colour of the chart means:
 – chart on the current date
 – chart on the expiration date.
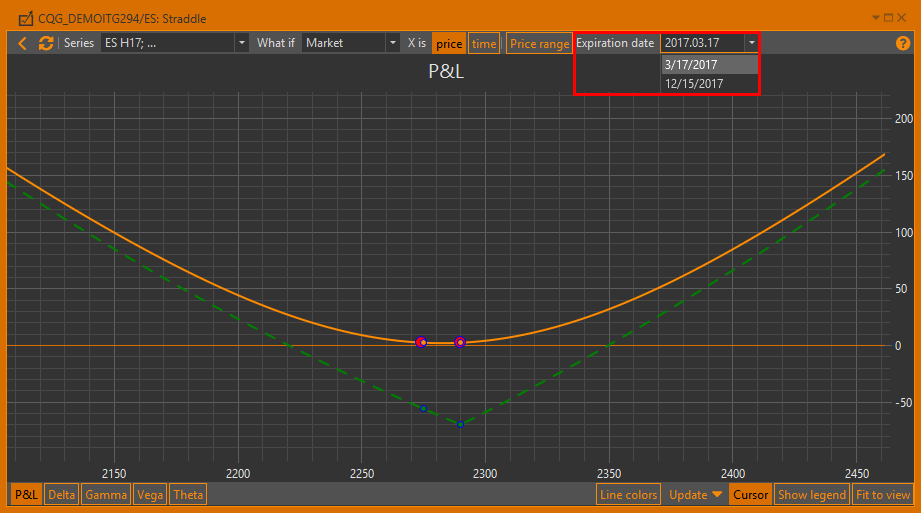
The drop-down list (Expiration date) with expiration dates of options is available
if there are options from the different series.You can select on which date to build the chart.
You may set different chart line parameters. For details on how to set line color, thickness or style (solid, dashed, dotted, etc.), see the Lines setup section.
Strikes of open positions in the selected strategies are marked by points on the chart. The current price of the underlying asset is shown with the red point. If the strategy contains option positions on different futures, each future will be shown with the red point marker.
If the strategy contains positions of different series, the user can view charts for each of them. First, select the series in the dropdown list [1] and update the chart [2].
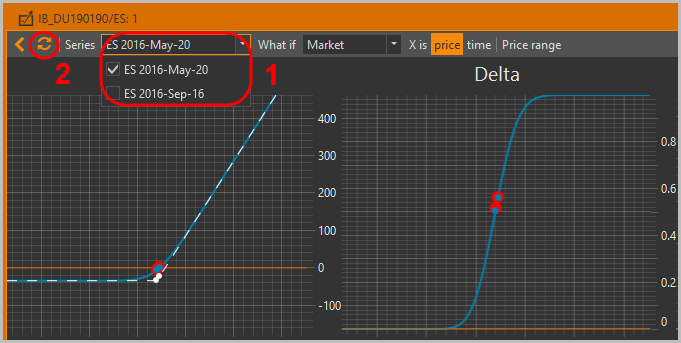
Chart settings
X-axis settings
By default, the X-axis shows the price of the underlying asset. You can change the price range manually or select the X-axis range using the slider control:
- Click the Price range button [1].
- Click-and-hold to set the lowest and the highest prices [2].
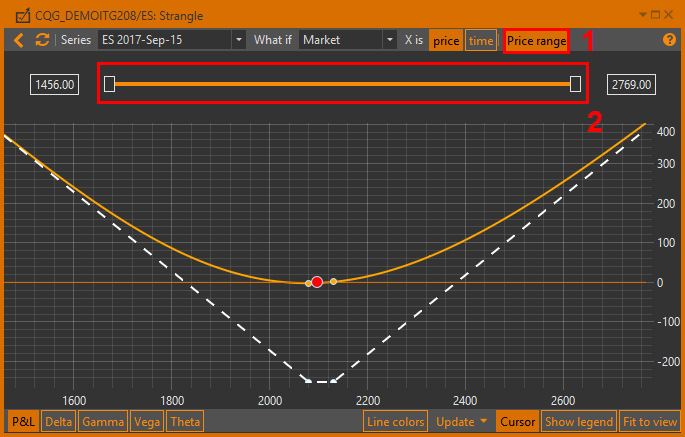

When you change (manually or by using the slider control) the price range the charts are updated automatically.
To view changes in the strategy parameters depending on expiration date, click Time in the X is field. The following figure shows an example of a chart.

Days to expiration date are shown by the x-axis. Point 0 on the X-axis is the current date.
Therefore, at the current price of the underlying asset the profit rate will fall closer to the expiration date.
Chart update
To refresh the charts manually:
- Click the
 button; or
 - Click the pop-up button labeled Click to apply changes that opens while changing a price range, selecting the series or scenario.
Alternatively, you can set up the charts window to refresh automatically:
- By timer – select Refresh interval from the drop-down list on the bottom toolbar and check the Update every checkbox
- When you change positions – check the Update on position change checkbox (which is set by default)
Note that if you have added or removed positions in selected strategies or edited their properties or edited what-if scenarios (even if they are currently selected), then refreshing charts will reflect those changes. So you don't need to reopen the strategy charts window every time you make any changes.
Crosshair and legend
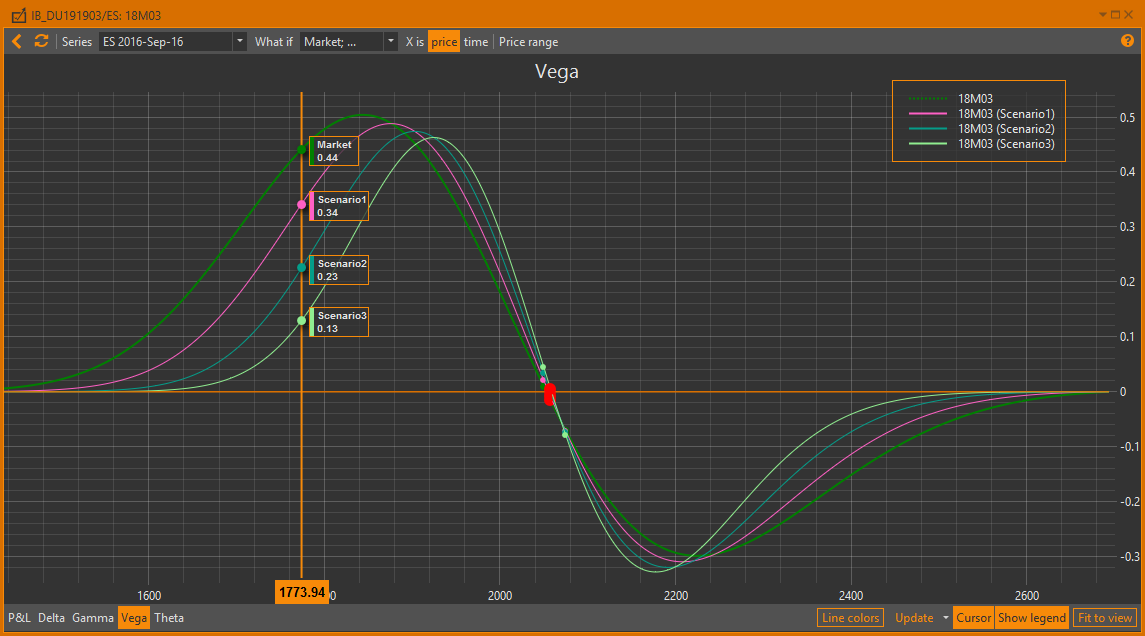
Placing the cursor over the chart will generate a tooltip containing the value of the data point on the X-axis and Y-axis. To display the guide lines, click on the Cursor button. To hide or show the legend, use the Show legend button on the bottom of the Strategy chart form.
Lines setup
If you're working with lots of strategies simultaneously, you may set different chart line parameters for each:
Click the Line colors button on the bottom toolbar and the following dialog will pop-up.

Select the desired strategy [1].
Set line parameters, such as line color, thickness or style (solid, dashed, dotted, etc.) for the current date line [2] and for the futures expiration date [3].
Click the OK button to apply the settings.
Profit/loss chart taking the commission into account
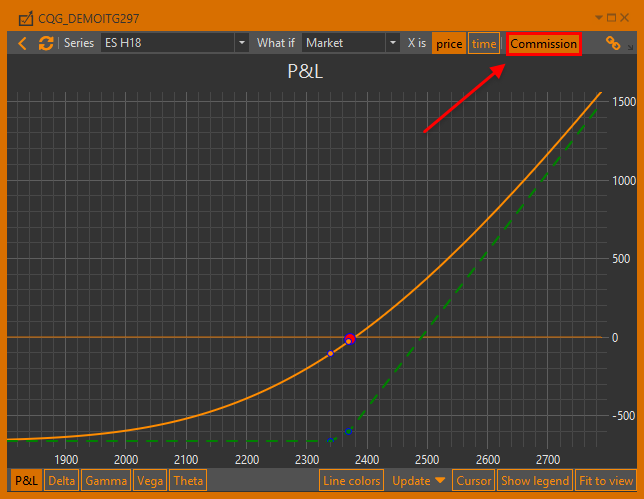
To display the profit/loss chart taking the commission for the fills into account click on the Commission button. The chart is shifted down to the size of the commission. Information about how to set the commission size for the fill is given here.
Binding the Charts form and active strategy in the Position manager
You can bind the strategy charts form and the active strategy.
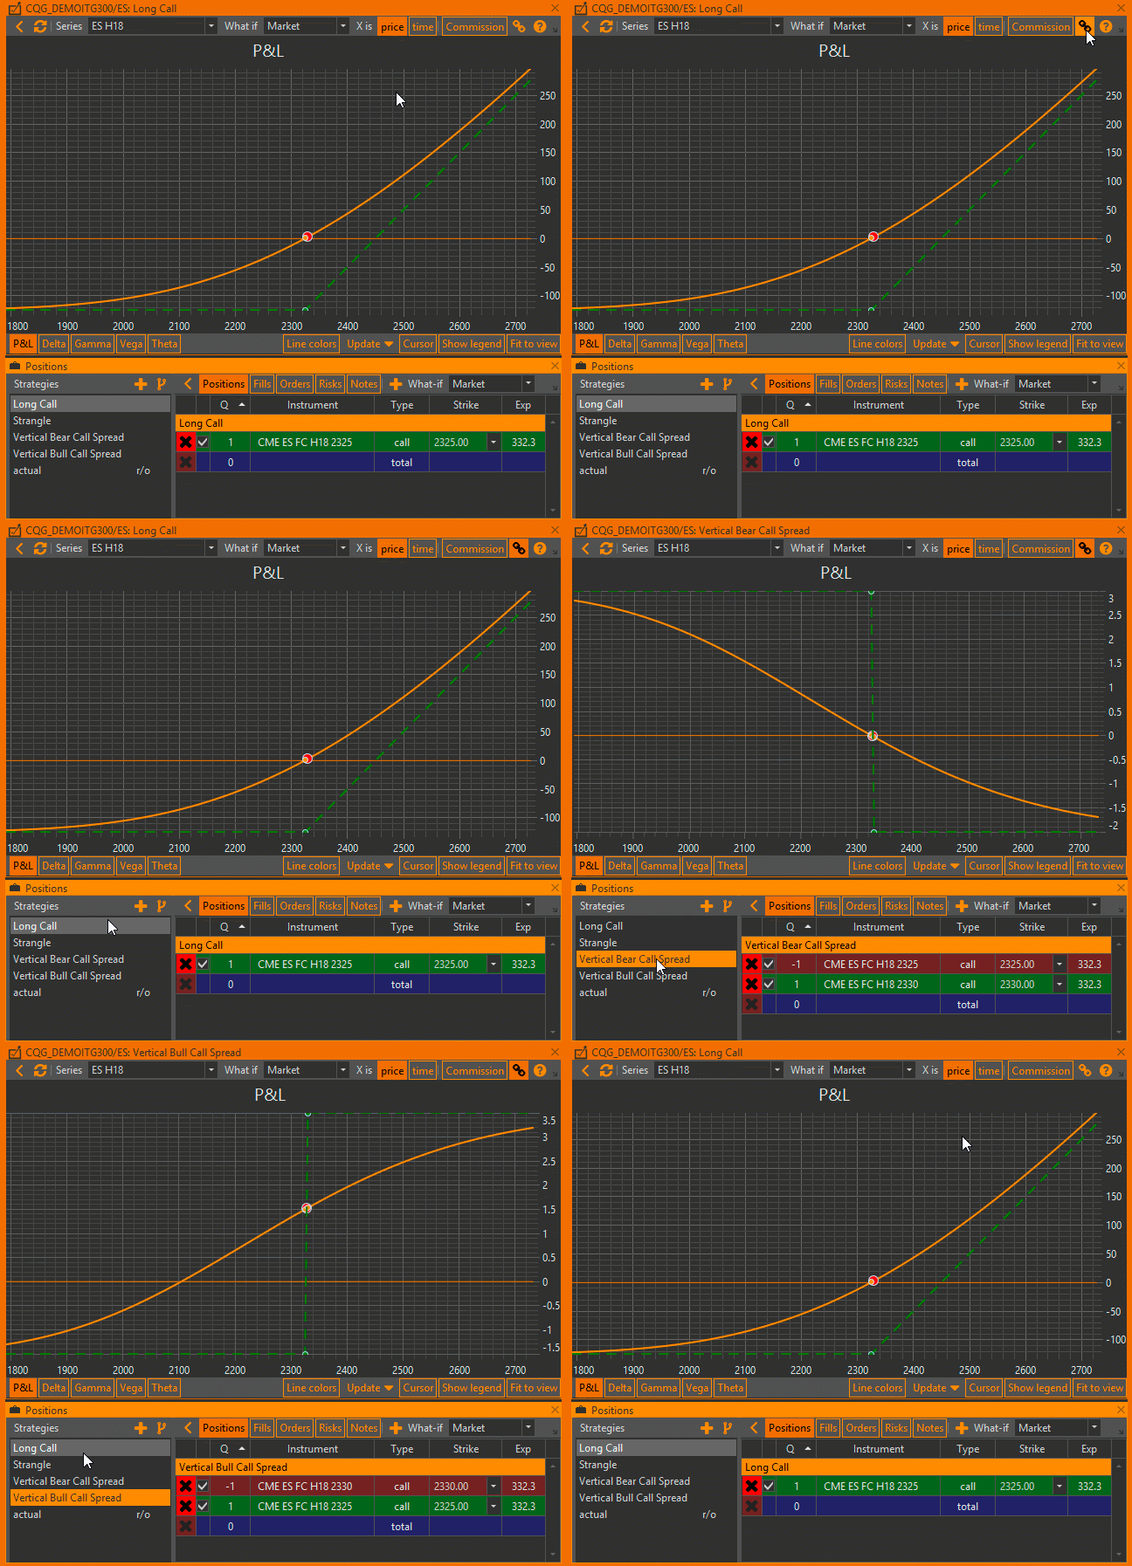
Click the Bind button. Now, when switching between strategies in the Position Manager, the charts will be automatically redrawn. The price range and zoom are saved separately for each strategy.
Using scenarios with charts
Initially, the chart shows only market chart lines, but you may add more chart lines using what-if scenarios:
- Expand the What-if scenarios selector in the top toolbar.
- Select the what-if scenarios you want to display.
- Click
 on the top toolbar or click the pop-up button labeled Click to apply changes.
Note that there is market scenario, which represents the current market situation.
If no user scenarios are selected, then market scenario will be selected automatically.

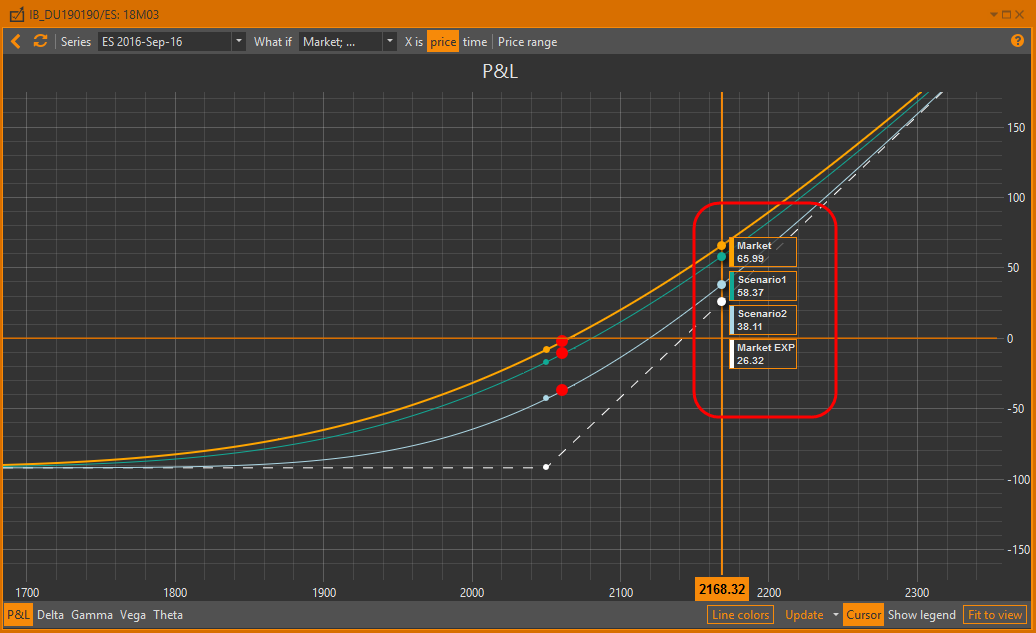
The PnL chart below shows an example of applying scenarios using a different time until expiration. Hovering the mouse over any point on the chart creates a pop-up info window with the values of profit/loss for each scenario.
Examples of the strategy and scenarios charts are below.
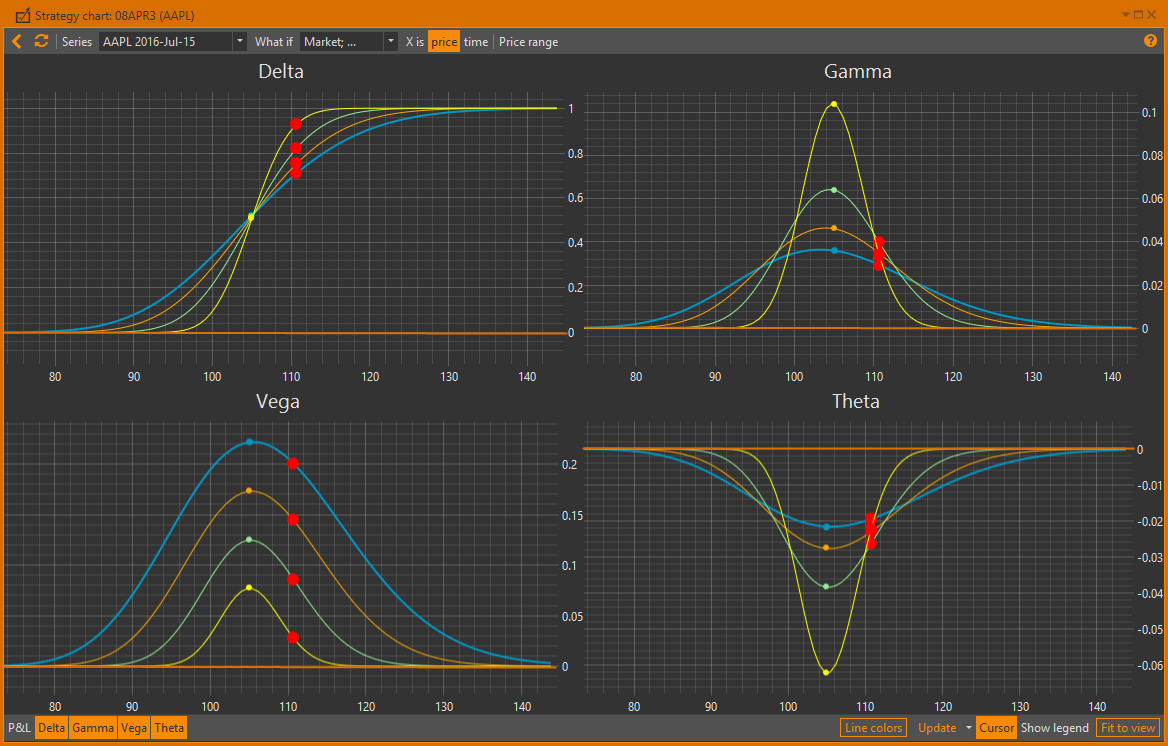
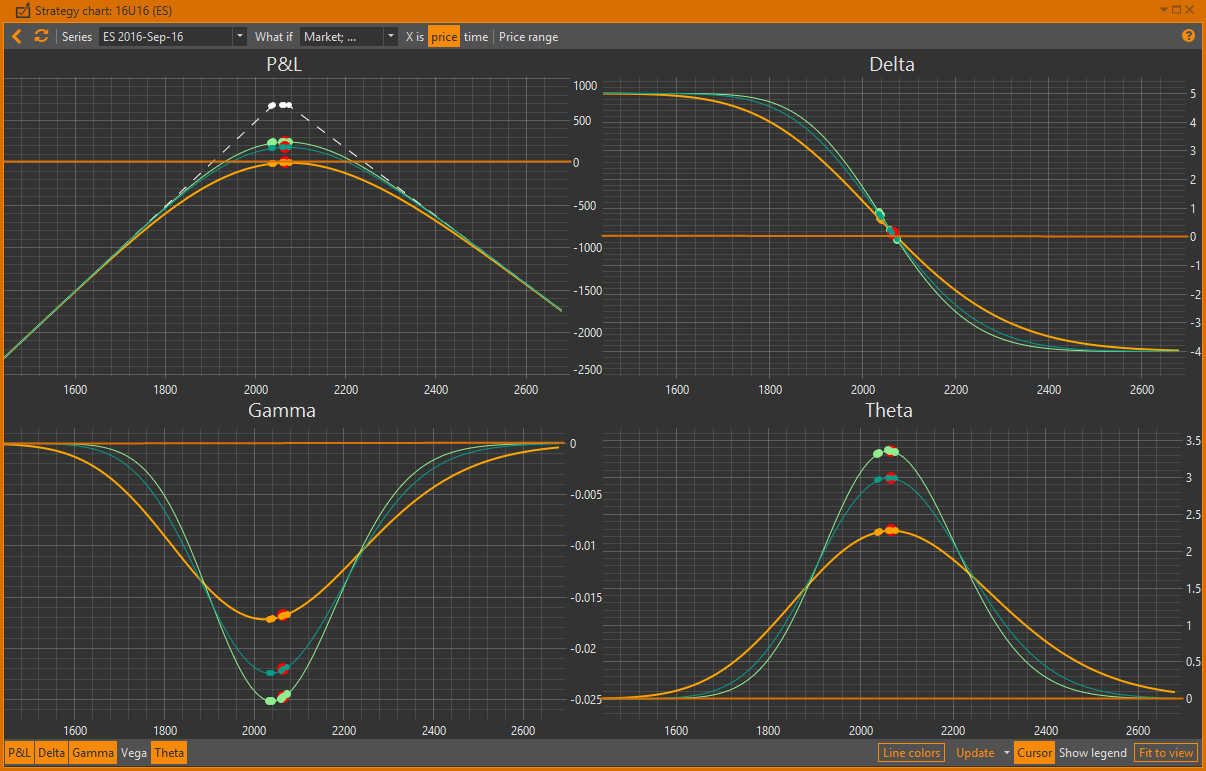
Chart display settings
You can scale and move the chart in several ways:
- Mouse wheel – scroll the chart horizontally.
- Shift+mouse wheel – scroll the chart vertically.
- Ctrl+mouse wheel – scaling.
- To scale into a certain area, hold the right mouse button and select the area.
- To return to default size double-click the left mouse button on the chart (or click the Fit to view button in the bottom toolbar).
- To move the chart, click the left mouse button and hold it pressed while moving the cursor.
To maintain horizontal and vertical zoom ratio, hold the right mouse button while dragging the X-axis or Y-axis.

To scroll the chart horizontally or vertically, hold the left mouse button while dragging the X-axis or Y-axis. Basic chart settings, such as the charts visibility and X-axis range, are automatically saved, so you do not need to set them each time you open a Strategy chart. Any other chart settings (selected what-if scenarios, chart line parameters, auto-refresh mode, charts' zooming and positioning) are reset when a Strategy chart window is opened.

