One Easy fix for traders getting stopped out too early or cutting profits too soon
If you’ve traded actively for at least a few months or years, you’ll know all too often the agony that comes with getting stopped out of a position and immediately, the trade takes off. A similar but lesser form of agony is felt when a trade has hit your price target and you proudly sell your position. Except, it keeps going and going…
I know I’ve felt these emotions more times than I can count. If only there was some magic indicator which would give me the expected range of the overall market, I could better set my stop loss and profit taking levels.
Fortunately, I eventually figured out that the VIX index is a simple and solid indicator for this. What is the VIX index?
I instinctively check VIX throughout the day to make sure it is within “normal ranges” when putting on and taking off trades. Just take a look at the below chart:
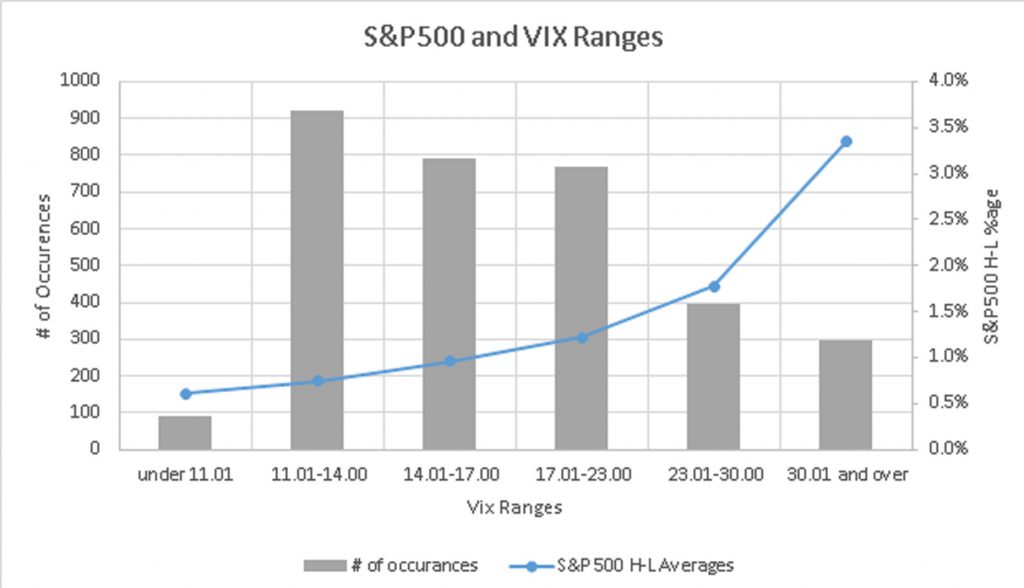
Whenever the VIX is under 17, the S&P500 daily range averages less than 1% (High of day minus Low of day). And most of the time the VIX is under 14, the S&P500 range averages less than 0.7%. However, when the index is trading close to 17 or higher, more extreme moves in the S&P500 can be expected with much greater predictability.
Here is a breakdown of the graph in table format:
| VIX Values | S&P 500 H-L Averages | # of Occurrences | %age of Occurrences |
|---|---|---|---|
| under 11.01 | 0.61% | 92 | 2.8% |
| 11.01-14.00 | 0.74% | 919 | 28.2% |
| 14.01-17.00 | 0.96% | 793 | 24.3% |
| 17.01-23.00 | 1.22% | 768 | 23.5% |
| 23.01-30.00 | 1.78% | 397 | 12.2% |
| 30.01 and over | 3.35% | 295 | 9.0% |
Even traders who do not trade options must pay close attention to the VIX index to avoid exiting positions too early and getting whipsawed. Equally important, when volatility is low, don’t expect big moves especially in names highly correlated to the S&P500 index in terms of direction and beta. In low volatility environments, you must take profits earlier and keep a tighter stop loss.
Here, we’ve provided an easy way to roughly gauge the market ranges for the day, but we could of course dig much deeper. For instance, we could combine volume, sector and many other factors in our analysis and come up with more accurate measures of range not just for the overall market, but also for certain sectors and stocks.
Perhaps, in the future, this analysis will come, but for now, pay attention to the VIX.
Until next time….Always stick with your risk limits and Happy Trading!


Tuesday, 20 December 2016